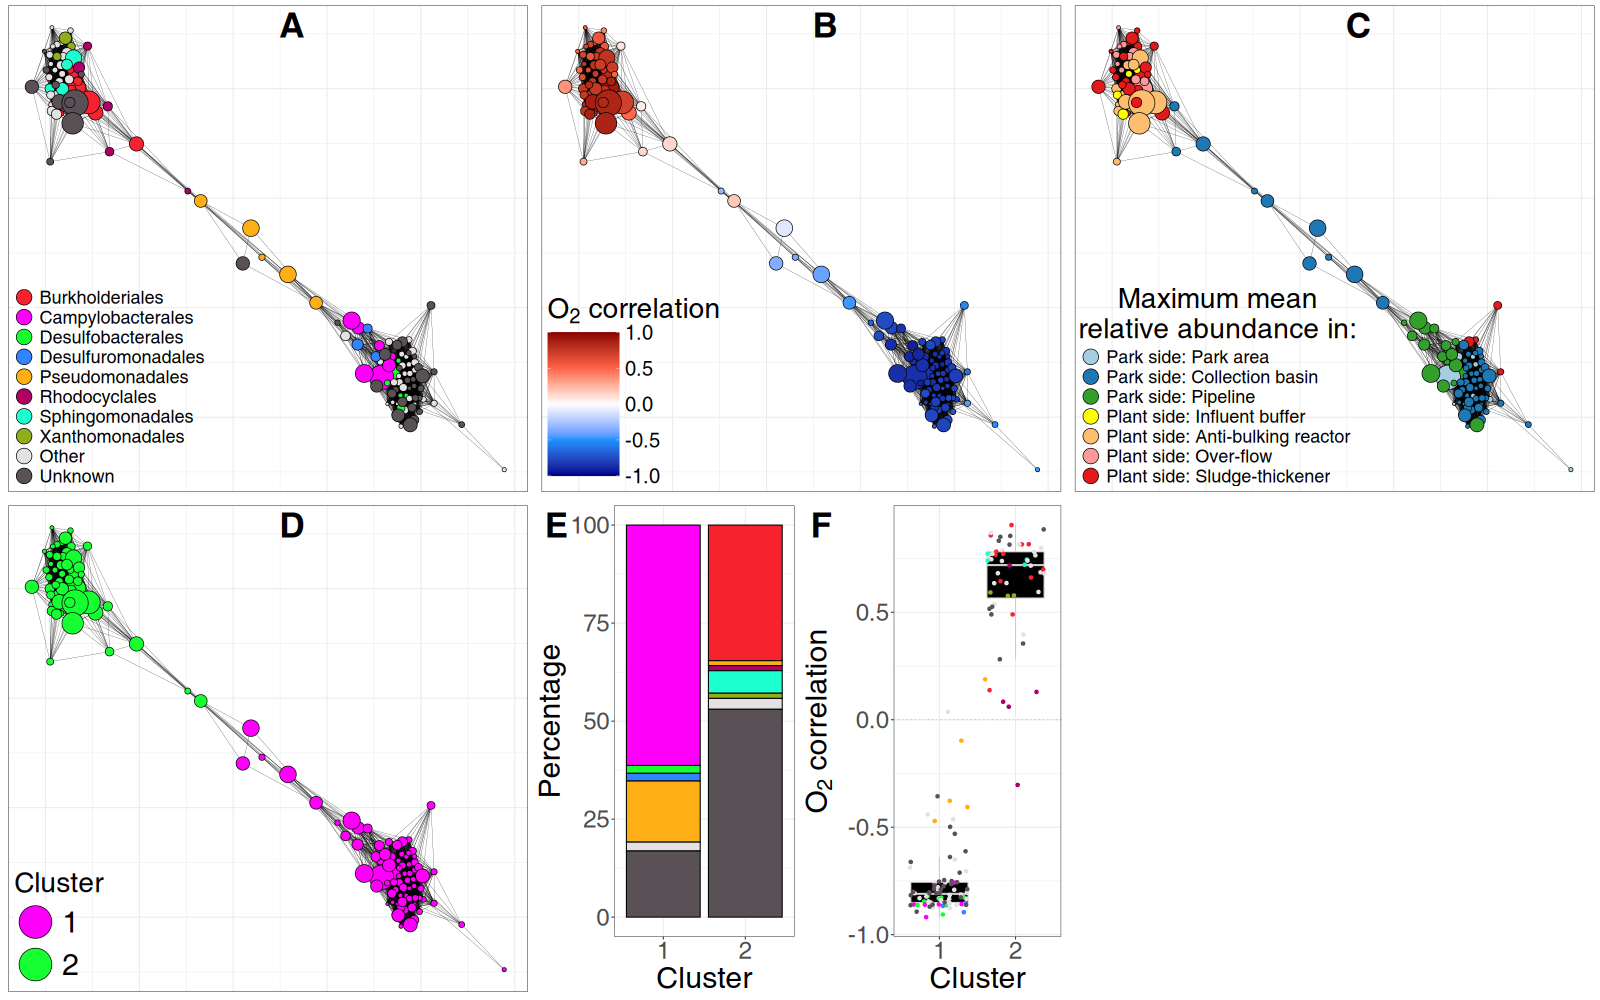
SpeSpeNet co-abundance network of the microbiome in a poly-contaminated city park and the corresponding water treatment plant (Hauptfeld et al)
Nodes are genera and edges are SparCC correlations > 0.63. A) Network colored by taxonomic annotation at the order rank. B) Network colored by Pearson correlation with O2 levels. The bottom-right cluster corresponds to genera preferring lower O2 and the top-left cluster consists of genera that prefer higher O2 levels. C) Network colored by the sampling site in the park/remediation pipeline in which genera were most abundant. The genera in the bottom-right cluster prefer the park side and the microbes in the top-left cluster prefer the plant-side. D) Network colored by k-means cluster assignment with k = 2. The k-means algorithm correctly groups genera into two co-abundance clusters that were already visually obvious. E) Barplot of taxonomic composition at order rank for the co-abundance clusters from D. Colors as in A. F) Distribution of correlation values with O2 for the genera in the clusters from D. Co-abundance cluster 1 shows the microbial community in the park side, and cluster 2 in the plant side of the remediation pipeline. Colors as in A.